What are heat maps?
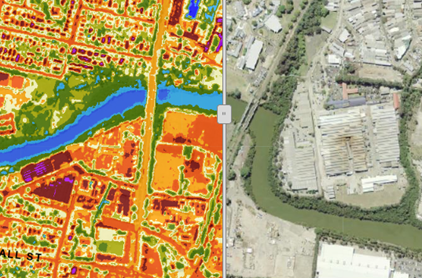
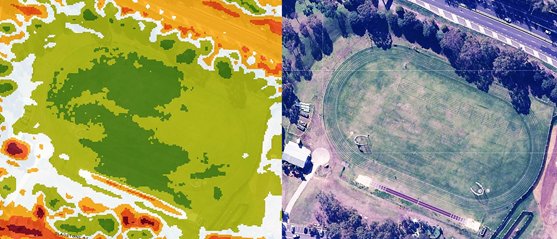
(Back to top)Heat maps are a mapping tool that shows surface temperatures using a colour scale. Generally, blues show cooler temperatures while reds show higher temperatures. Heat maps provide a snapshot of the surface temperatures.
It is important to note that thermal maps may use different colour scales, so be careful to check the legend!
We know that hard surfaces in urban areas, such as roads, roofs and paths, absorb heat from the sun during the day, and then release this stored heat at night. Heat maps give us a clear picture of where there is excess heat being absorbed and released.
Heat maps also allow you to see how features in the natural environment influence local temperatures.
The City of Parramatta heat maps allow you to search for a specific address (prior to Council amalgamation) and see the surface temperature of the built and natural environment features at the location, for both the day and night.
How do I use heat maps?
(Back to top)Take a few minutes to watch this clip that explains how to use the City of Parramatta heat maps.
How is the City of Parramatta using these heat maps?
(Back to top)The heat maps play a role in how we plan a range of projects, including:
- The identification of areas to priorities for additional tree planting
- The identification of areas which may be more vulnerable to increasing urban heat
- The identification of areas which may require additional support in remaining safe and healthy in heatwave events
- The selection of suitable areas to trial different technologies to combat urban heat
How were the heat maps created?
During the summer of 2012/13, the City of Parramatta captured thermal images of the Council area. Since this time, the Council area has changed through the amalgamation process in 2016. As a result, not all areas within the current City are shown in these thermal maps.
These thermal images were captured by flying over the City at between 6000 and 10 000 feet with multispectral and thermal cameras. This gives the maps an average view to 1 metre.
The heat maps allow you to search for a specific address and see the surface temperature of the built and natural environment features at the location, for both the day and night.
The average temperatures in the City on the date of the capture were 35.8°C during the day and 22.6°C at night.
For more information
Contact the Customer Service Centre on 9806 5050 or council@cityofparramatta.nsw.gov.au


